Making a heat map of Apple Watch workouts
Context
The Apple Watch and other smartwatches record a humoungus amount of data about what you do every day. This post will show you one of the visualizations you can build for that data: how to build a heatmap of your walks or ride.
This is what the final product looks like (truncated view to preserve privacy):

How to get the data
I downloaded the data from my iPhone by going to the health app and clicking on
my profile and then clicking on “Export All Health Data”. I unpacked the zip
archive and it gave me both files and folders. One of the folder is called
workout-routes, it contains all the gpx (format to store gps route) traces for
my workouts.
Building the heatmap
I decided to use https://github.com/remisalmon/Strava-local-heatmap. Calling it with the following arguments (I researched the bounding box for San Francisco where I live):
python3 strava_local_heatmap.py \
    --gpx-filter '*2019*' \
    --gpx-dir ~/Downloads/HEALTHDATA/apple_health_export/workout-routes \
    --zoom 15 \
    --gpx-bound 37.6040 37.8324 -123.0137 -122.3549
It failed to complete for two reasons: (1) my python3 distribution wasn’t built with
tkinter, and (2) it claimed that no data was present. (1) was trivial to fix as
you can see below. For (2) I did a bit of debugging and realized that strava_local_heatmap.py parses xml using regexp instead of
using a regular XML parser. It made assumption about the order of the fields that
didn’t match the way that Apple serializes the data. I fixed both
of those issues and tried again:
From 12eb2b1bbccf64707891f5bda5ee139bfbe0677e Mon Sep 17 00:00:00 2001
From: xxxx
Date: Sat, 14 Mar 2020 12:54:26 -0700
Subject: [PATCH] Make it work on Mac OS with apple watch data

---
 strava_local_heatmap.py | 4 +++-
 1 file changed, 3 insertions(+), 1 deletion(-)

diff --git a/strava_local_heatmap.py b/strava_local_heatmap.py
index 9fd4e70..8388869 100644
--- a/strava_local_heatmap.py
+++ b/strava_local_heatmap.py
@@ -28,6 +28,8 @@ import urllib.error
 import urllib.request

 import numpy as np
+import matplotlib
+matplotlib.use('agg')
 import matplotlib.pyplot as plt

 # parameters
@@ -145,7 +147,7 @@ def main(args):
                             if '<trkpt' in line: # trackpoint latitude, longitude
                                 tmp = re.findall('-?[0-9]*[.]?[0-9]+', line)

-                                lat_lon_data.append([float(tmp[0]), float(tmp[1])])
+                                lat_lon_data.append([float(tmp[1]), float(tmp[0])])

                     else:
                         break
--
2.25.0
I didn’t contribute this change back to Strava local heatmap as the readme indicates that an explicit goal of the project is not to do real XML parsing. That is a questionable decision is you ask me.
More ideas
I tried all the following exploration with my health data:
- Join heart monitoring data with calendar data to identify what meetings are stressing you out the most!
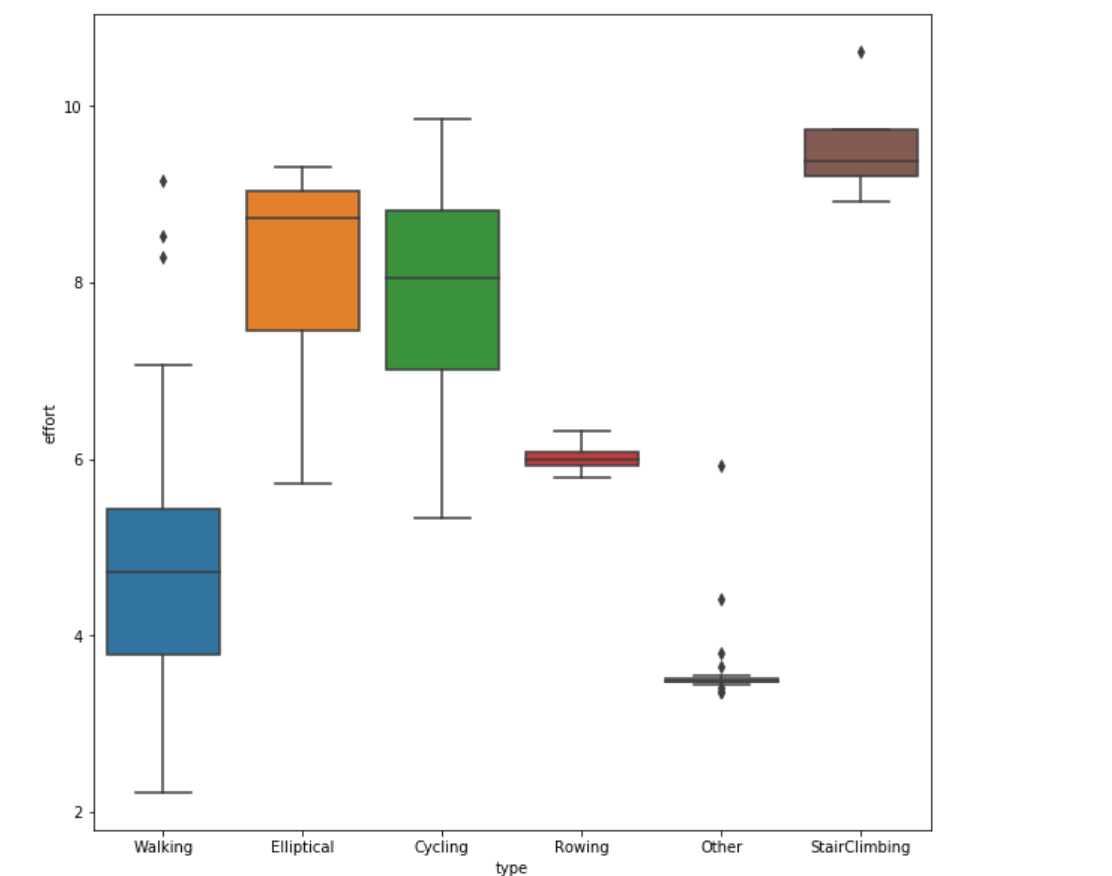
- Identify the activities that are the most worth it for burning calories (effort == calories per minute). This is the result for mine, as expected stair climbing is worth it!

- Identify long term trends in heart rate or any other metrics