NVR Proxy: Turning Security Cameras into Prometheus Metrics with Scheduled LLM Analysis
I wanted to track who’s home without building a complex computer vision pipeline. The solution: schedule a local LLM to analyze security camera frames every 5 minutes, output structured JSON, and export the results as Prometheus metrics. Now Grafana shows me family presence over time.
The Pattern: Scheduled Jobs → JSON → Prometheus
The architecture is simple:
- Scheduled job captures a frame from the NVR every N minutes
- Local vision model (Qwen3-VL via Ollama) analyzes the frame with a prompt requesting JSON output
- JSON parser extracts structured data from the LLM response
- Prometheus endpoint exports the parsed data as metrics
- Grafana visualizes presence patterns over time
This pattern works for any scenario where you want to convert unstructured visual data into time-series metrics without training custom models.
The Implementation
Scheduled Jobs
Jobs are defined with a name, camera channel, prompt, and frequency:
type ScheduledJob struct {
    ID                   string
    Name                 string
    Channel              int        // NVR camera channel
    Prompt               string     // LLM prompt requesting JSON
    Model                string     // "auto" or specific model
    Precision            string     // low/medium/high/very_high
    FrequencyMins        int
    Enabled              bool
    IncludePreviousState bool       // Include last result for context
    LastRunAt            *time.Time
}
A background runner checks every 30 seconds for due jobs:
func (r *Runner) loop() {
    ticker := time.NewTicker(30 * time.Second)
    for {
        select {
        case <-r.stopCh:
            return
        case <-ticker.C:
            r.checkAndRunDueJobs()
        }
    }
}

func (r *Runner) checkAndRunDueJobs() {
    jobs, _ := r.jobRepo.ListEnabled(ctx)
    for _, job := range jobs {
        if job.IsDue() {
            r.service.ExecuteJob(ctx, job)
        }
    }
}
The Prompt: Requesting Structured JSON
The key is crafting a prompt that reliably produces parseable JSON:
Analyze this security camera frame from my living room.
Identify any people and dogs you see.

Return ONLY a JSON object with this structure:
{
  "datetime": "YYYY-MM-DD HH:MM:SS",
  "people": [{"name": "...", "action": "...", "room": "..."}],
  "dogs": [{"name": "...", "action": "..."}]
}

Known family members: Laurent, Gisue, Azita, Leonie, Luca
Known dogs: Lily, Lumi
The IncludePreviousState flag adds temporal context:
if job.IncludePreviousState {
    if lastResult, err := s.resultRepo.GetLastByJob(ctx, job.ID); err == nil {
        prompt = fmt.Sprintf("%s\n\n**Previous state (5 minutes ago):**\n```json\n%s\n```\nUse this as context.", job.Prompt, lastResult.Response)
    }
}
This helps the model track continuity—if someone was sitting on the couch 5 minutes ago and the image looks similar, they’re probably still there.
Parsing JSON from LLM Responses
LLMs don’t always return clean JSON. They might wrap it in markdown code blocks or add commentary. The parser handles this:
func extractJSON(s string) string {
    // Try markdown code blocks first
    if idx := strings.Index(s, "```json"); idx >= 0 {
        start := idx + 7
        if end := strings.Index(s[start:], "```"); end >= 0 {
            return strings.TrimSpace(s[start : start+end])
        }
    }
    // Fall back to finding raw JSON object
    if idx := strings.Index(s, "{"); idx >= 0 {
        depth := 0
        for i := idx; i < len(s); i++ {
            switch s[i] {
            case '{': depth++
            case '}': depth--
                if depth == 0 {
                    return s[idx : i+1]
                }
            }
        }
    }
    return ""
}
The parsed response updates an in-memory presence state:
type PresenceState struct {
    mu          sync.RWMutex
    lastUpdated time.Time
    people      map[string]PersonPresence
    dogs        map[string]DogPresence
}

func (ps *PresenceState) UpdateFromResponse(response string) error {
    jsonStr := extractJSON(response)
    var ar AnalysisResponse
    json.Unmarshal([]byte(jsonStr), &ar)

    // Reset all to not-present, then mark detected entities
    for _, p := range ar.People {
        ps.people[p.Name] = PersonPresence{
            Present: true,
            Action:  p.Action,
            Room:    p.Room,
        }
    }
}
Exporting to Prometheus
The /metrics endpoint converts presence state to Prometheus format:
func (s *Server) handleMetrics(w http.ResponseWriter, r *http.Request) {
    people, dogs, lastUpdated := s.schedulerService.GetPresenceMetrics()

    w.Header().Set("Content-Type", "text/plain; version=0.0.4")

    fmt.Fprintf(w, "# HELP nvr_proxy_presence_person Is person present (1=yes, 0=no)\n")
    fmt.Fprintf(w, "# TYPE nvr_proxy_presence_person gauge\n")
    for name, presence := range people {
        val := 0
        if presence.Present { val = 1 }
        fmt.Fprintf(w, "nvr_proxy_presence_person{name=%q} %d\n", name, val)
    }

    fmt.Fprintf(w, "# HELP nvr_proxy_presence_dog Is dog present (1=yes, 0=no)\n")
    fmt.Fprintf(w, "# TYPE nvr_proxy_presence_dog gauge\n")
    for name, presence := range dogs {
        val := 0
        if presence.Present { val = 1 }
        fmt.Fprintf(w, "nvr_proxy_presence_dog{name=%q} %d\n", name, val)
    }

    fmt.Fprintf(w, "# HELP nvr_proxy_presence_age_seconds Time since last update\n")
    fmt.Fprintf(w, "nvr_proxy_presence_age_seconds %.0f\n", time.Since(lastUpdated).Seconds())
}
Sample output:
# HELP nvr_proxy_presence_person Is person present (1=yes, 0=no)
# TYPE nvr_proxy_presence_person gauge
nvr_proxy_presence_person{name="laurent"} 0
nvr_proxy_presence_person{name="gisue"} 0
nvr_proxy_presence_person{name="leonie"} 1
nvr_proxy_presence_person{name="luca"} 1
# HELP nvr_proxy_presence_dog Is dog present (1=yes, 0=no)
# TYPE nvr_proxy_presence_dog gauge
nvr_proxy_presence_dog{name="lily"} 1
nvr_proxy_presence_dog{name="lumi"} 0
# HELP nvr_proxy_presence_age_seconds Time since last update
nvr_proxy_presence_age_seconds 14
Prometheus scrapes this endpoint, and Grafana queries it to show presence over time.
The UI
Scheduled Jobs Management
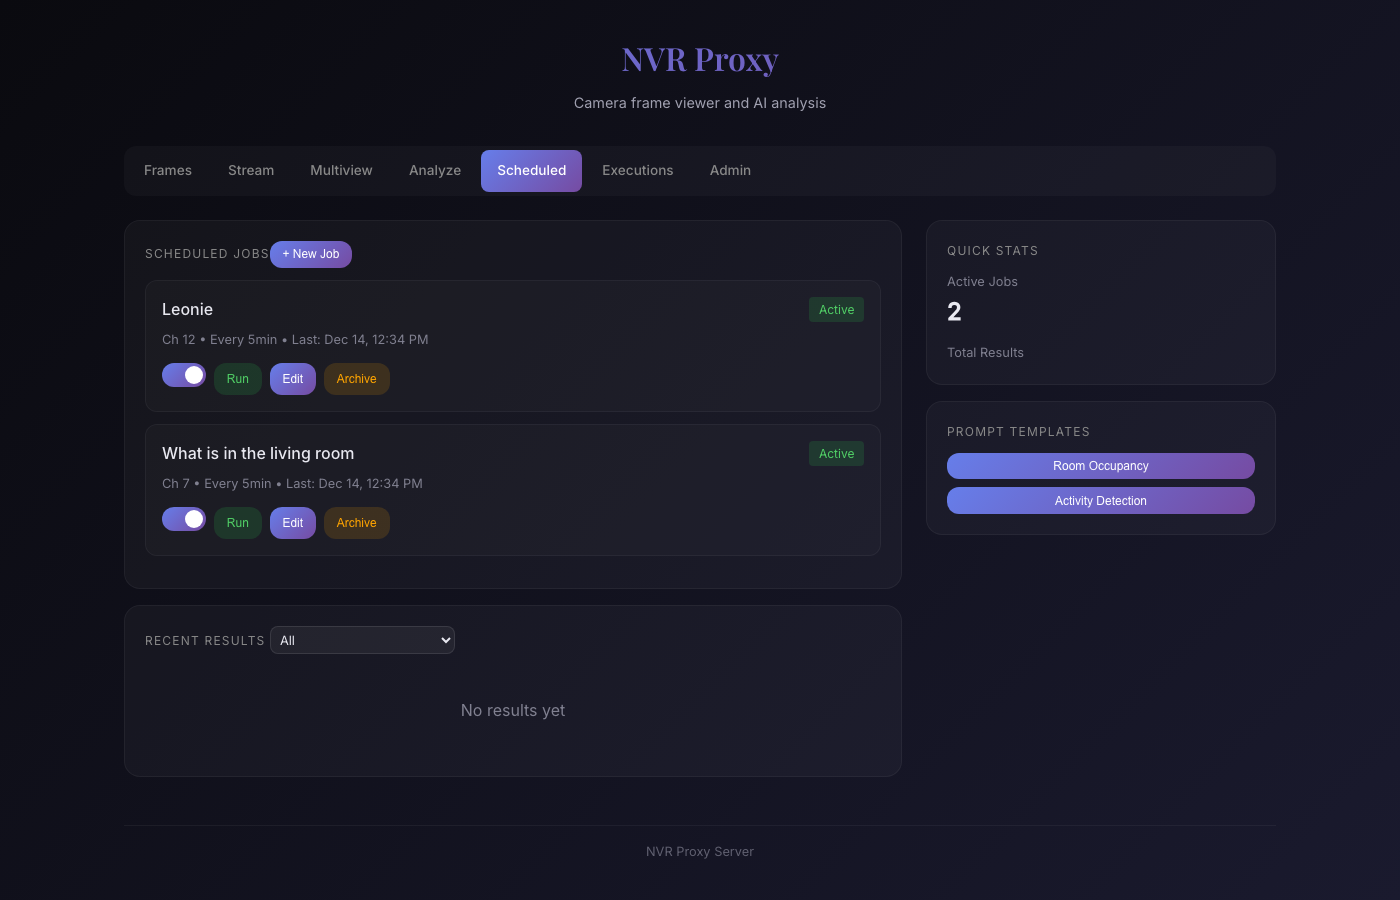
The scheduled jobs page shows active jobs with their channels, frequencies, and last run times. Each job can be run manually, edited, or archived.
Interactive Analysis
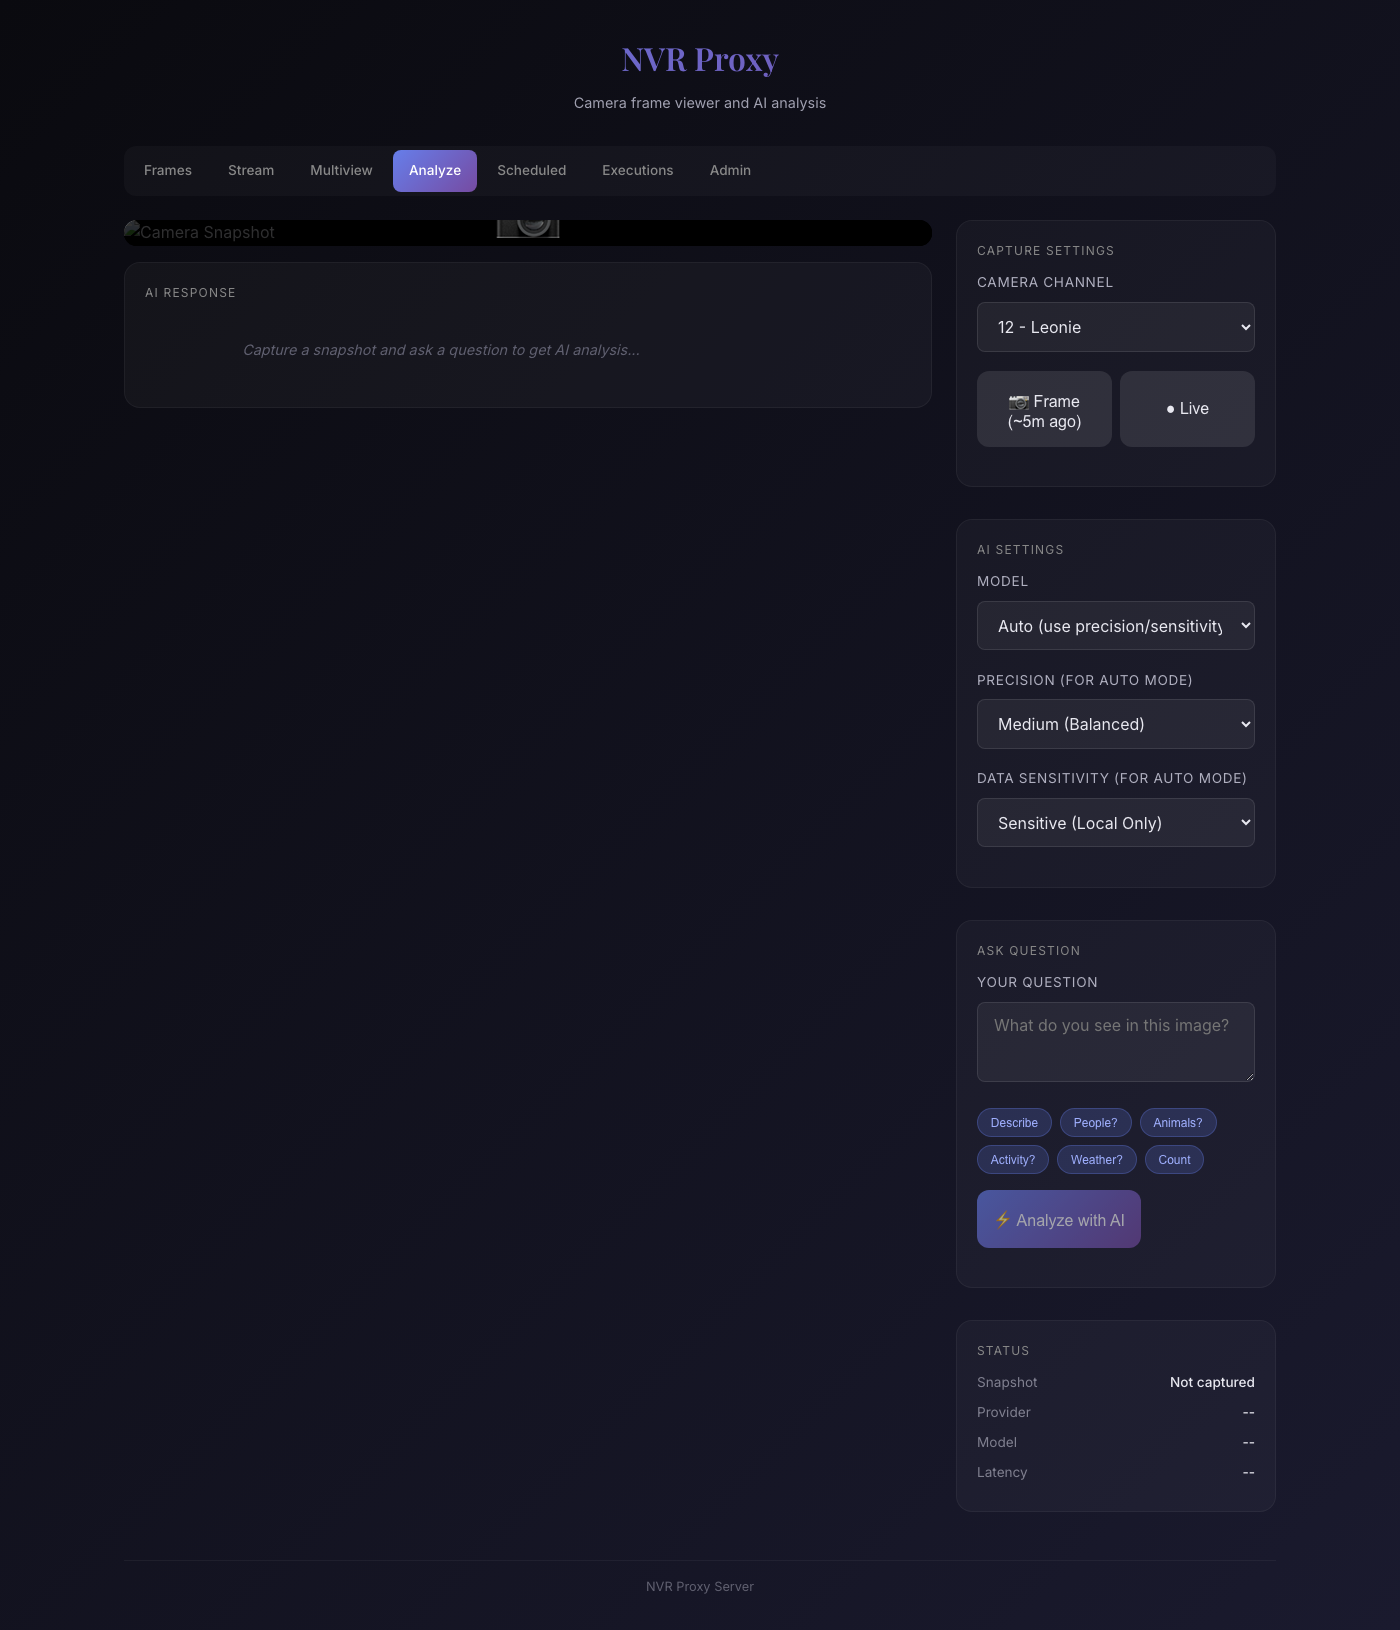
The analyze page allows ad-hoc analysis—useful for testing prompts before scheduling them. You can select a camera, choose frame vs live, set model parameters, and ask questions with quick prompts like “People?”, “Animals?”, or “Activity?”.
Why Local Models Matter
The secret sauce here is Qwen3-VL:30B—a vision-language model that’s genuinely impressive for self-hosted inference. It reliably identifies people, understands spatial relationships, and outputs well-structured JSON. Running via Ollama on my Mac Studio, it processes a frame in under 10 seconds with remarkable accuracy. A year ago, this level of vision capability required cloud APIs; now it runs entirely on local hardware.
All scheduled jobs run with Sensitive=true, forcing local-only inference via LLM Proxy. This matters because:
- Privacy: Camera footage never leaves my network
- No API costs: Qwen3-VL runs free on my Mac Studio’s 192GB unified memory
- No rate limits: I can run analysis every minute if needed
- Reliability: No dependency on external services
analysisReq := analysis.Request{
    Image:     dataURL,
    Question:  prompt,
    Model:     job.Model,
    Precision: job.Precision,
    Sensitive: true,  // Always local-only for scheduled jobs
    Usecase:   "nvr-proxy-scheduled",
}
The Data Pipeline
┌─────────────┐     ┌─────────────┐     ┌─────────────┐
│   NVR       │────▶│  NVR Proxy  │────▶│  LLM Proxy  │
│  (frames)   │     │  (Go svc)   │     │  (routing)  │
└─────────────┘     └─────────────┘     └─────────────┘
                           │                   │
                           │                   ▼
                           │            ┌─────────────┐
                           │            │   Ollama    │
                           │            │ (Qwen3-VL)  │
                           │            └─────────────┘
                           │                   │
                           ▼                   │
                    ┌─────────────┐            │
                    │  Presence   │◀───────────┘
                    │   State     │   (JSON response)
                    └─────────────┘
                           │
                           ▼
                    ┌─────────────┐     ┌─────────────┐
                    │  /metrics   │────▶│ Prometheus  │
                    │  endpoint   │     └─────────────┘
                    └─────────────┘            │
                                              ▼
                                       ┌─────────────┐
                                       │  Grafana    │
                                       └─────────────┘
Practical Applications
This pattern extends beyond presence detection:
- Package delivery: “Is there a package at the front door?”
- Vehicle tracking: “How many cars are in the driveway?”
- Pet monitoring: “Is the dog in the backyard?”
- Weather conditions: “Is it raining? Snowing? Sunny?”
- Activity classification: “What activity is happening in this room?”
Each becomes a scheduled job with a tailored prompt, producing metrics you can alert on or visualize.
Key Learnings
- Prompt engineering for JSON: Be explicit about the output format, provide examples, and handle parsing failures gracefully
- Temporal context helps: Including previous state in prompts improves consistency
- Local inference is practical: Modern vision models on Apple Silicon are fast enough for 5-minute polling
- Metrics are composable: Once data is in Prometheus, it integrates with all your existing dashboards and alerts
Running It
NVR Proxy runs on my homelab at robot.lan:4444, deployed via Ansible:
cd ~/repos/homelab
ansible-playbook playbook_services_experimental.yml --tags nvr-proxy
It connects to:
- My Reolink NVR for camera frames
- LLM Proxy at
llm-proxy.lanfor vision analysis - Prometheus for metrics scraping
The combination of cheap NVR hardware, local LLMs, and the Prometheus ecosystem creates a surprisingly capable home monitoring system—without cloud dependencies or custom ML training.